Prerequisites
Please go through the previous two posts of this thread:
Introduction
In my previous post, I had written about my experiments with pseudo-random images with integers & prime integers b/w 0-255. As I mentioned in my previous post, I would be covering pixel frequency generators in this post. Along with it, I would also be reviewing other normal topics, I have covered such as colour to greyscale image conversion, greyscale to binary conversion & pixel to integer composition & integer to pixel decomposition.
Program #1: Pixel frequency generator
It generates frequency plots for the image using a library called matplotlib. It’s quite simple to make, though it takes lots of time for processing large images (e.g. An image w/ a resolution of 480*640 would contain 307,200 pixels. The Bigger the resolution, the more time it will take.).
Here is the program, which can actually be broken down into a few methods for simplicity:
Method RGBToHex: This method converts the colour description from RGB to hexadecimal form. e.g.[41, 18, 56] => #291238Method RGBArrToRGBHex:This method converts an entire array of RGB arrays (i.e. a multi-dimensional array) to an array of hexadecimal representations of the colour.- Method FreqPlot: This method plots the frequency chart.
- Method PixFreq: This method calculates the frequency of the pixels and stores them in an array.
#Plotting frequency of pixel color in a given image
#Created by asxyzp (Aashish Panigrahi)
import matplotlib.pyplot as plt
import cv2
import numpy
RGBArr = []                     #Will Store RGB pixel list for conversion into hex value
RGBHex = []                     #Will Store RGB hex values for plotting
PixFrq =[]                      #Will store frequency for each pixel
tempArr = []                    #Temporary array for storing pixel values in a 1-D list


'''
    Name : RGBToHex(RGBList)
    Utility : Conversion of list [R,G,B] into a hexadecimal value
    Parameter(s) : RGBList - A list storing pixel values [R,G,B]
    Return value : Hex - Hexadecimal value corresponding to [R,G,B] pixel
'''
def RGBToHex(RGBList):
    R = hex(RGBList[0])
    G = hex(RGBList[1])
    B = hex(RGBList[2])
    return R+G[2:4]+B[2:4]


'''
    Name : RGBArrToRGBHex()
    Utility : Convets & stores values of RGBArr to RGBHex
    Parameter(s) : None
    Return value : None
'''
def RGBArrToRGBHex():
    for i in range(len(RGBArr)):
        RGBHex.append(RGBToHex(RGBArr[i]))


'''
    Name : FreqPlot()
    Utility : Generates frquency plot for each pixel
    Parameters(s) : None
    Return value : None
'''
def FreqPlot():
    countArr = []
    for i in range(len(RGBHex)):
        countArr.append(i)
    '''
    #Plotting points
    plt.plot(countArr,PixFrq,'k.')
    plt.xlabel("Pixel values")
    plt.ylabel("Frequency")
    plt.grid()
    plt.show()
    '''
    #Plotting bar graph
    plt.bar(countArr,PixFrq)
    plt.xlabel("Pixel values")
    plt.ylabel("Frequency")
    plt.grid()
    plt.show()


'''
    Name : PixFreq(ImgFile)
    Utility : Computes the frequency of [R,G,B] lists from an image & stores it in PixFreq
    Parameter(s) : ImgFile - Name of the image file for which stats have to be formed
    Return value : None
'''
def PixFreq(ImgFile):
    ImgFrame = cv2.imread(ImgFile,cv2.IMREAD_COLOR)     #Reading Image
    ImgRowLen = len(ImgFrame)                           #Stores the length of row of pixels
    ImgColLen = len(ImgFrame[0])                        #Stores the length of col of pixels

    #For storing pixel values in tempArr
    #2D list to 1D list conversion of pixels
    for i in range(ImgRowLen):
        for j in range(ImgColLen):
            tempArr.append(numpy.ndarray.tolist(ImgFrame[i][j]))
            #numpy.ndarray.tolist() converts numpy array to list

    for i in range(len(tempArr)):
        if tempArr[i] not in RGBArr:                    #Stores the value of unique value in the list
            RGBArr.append(tempArr[i])

    #Stores freq. of each pixel
    for i in range(len(RGBArr)):
        count = 0
        for j in range(len(tempArr)):
            if RGBArr[i] == tempArr[j]:
                count+=1
        PixFrq.append(count)

    RGBArrToRGBHex()                                   #Conversion of [R,G,B] to hex
    FreqPlot()                                         #Frequency plot
ImgName =  input("Name of image file/path (w/ file type. e.g. PNG/JPEG)?\t")
PixFreq(ImgName)
There are two sets of output for the above program: One from an image file asxyzp.jpeg & another from a pseudo-random image, as described in the previous post.
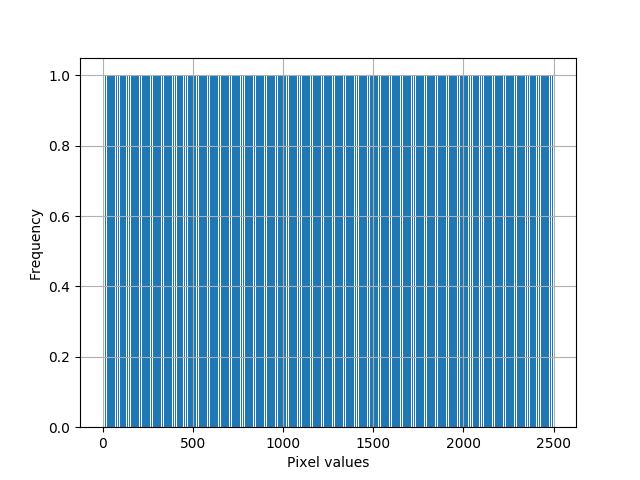
Output #1
For random image: As you can see below, the frequency represented in both the plots is a straight line, which means that the frequency of all pixels in the image is roughly the same.

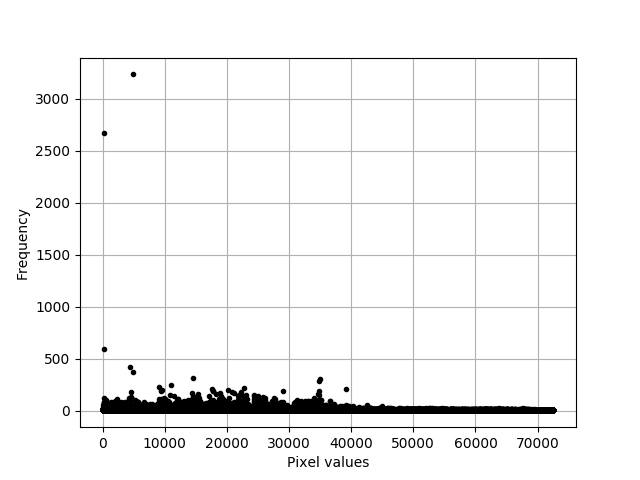
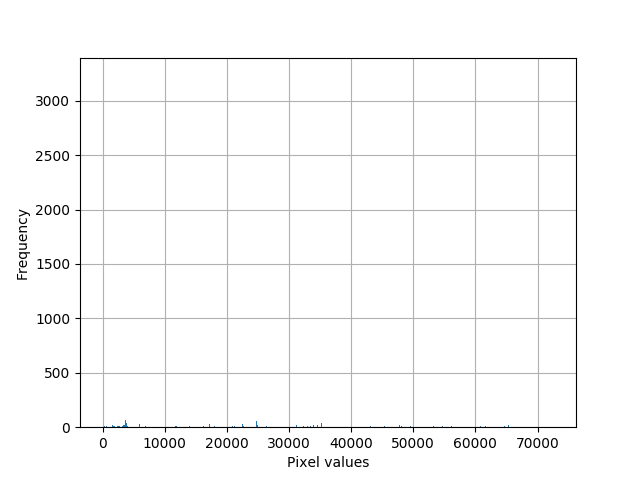
From asxyzp.jpeg: Here, you can find, something really fascinating: While most pixels have a frequency in b/w 0-500, there are pixels that have a frequency above 2500.
Program #2: Pixel to integer composition & integer to pixel decomposition
Being more curious, I wondered whether an image that is composed of thousands of pixel lists/arrays can be converted into a list/array of integers, because once we have an integer array/list, then we can do other kinds of experiments with it, such as matrix operations. And finally, today I made the program that does the composition of pixel to integers & vice versa, but initially, I was a bit confused & I had to take help from mathematics stack exchange. The program for this is below :
#Program to compose & decompose pixel to integer & integer to pixel, respectively
#Created by asxyzp (Aashish Panigrahi)
import cv2
import numpy
PhotoFrame = [] #Stores photo frame
PhotoNum = [] #Stores integer values after composition of pixel to an integer
NumDecomp = [] #Stores decomposed pixel lists
'''
Name : PixToInt(Pix)
Utility : Conversion of a Pixel to an integer
Parameter(s) : Pix - A numpy array/list which contains pixel [R,G,B] list
Return value : An integer value after composition
'''
def PixToInt(Pix):
return Pix[0]*pow(2,16) + Pix[1]*pow(2,8) + Pix[2]*pow(2,0) #Composition [REFER: MATH STACKEX]
'''
Name : IntToPix(Int)
Utility : Conversion of an integer
Parameter(s) : Int - An integer for pixel decomposition
Return value : A list/numpy array containing pixel images
'''
def IntToPix(Int):
R = Int//pow(2,16) #R Decomposition
Int = Int - R*pow(2,16)
G = Int//pow(2,8) #G Decomposition
B = Int - G*pow(2,8) #B Decomposition
return list([R,G,B])
'''
Name : RowPixToInt(ImgRow)
Utility : Converting a row of [R,G,B] pixels into a row of integers by composition
Parameter : ImgRow : A Row of pixels of an image
Return value : None
'''
def RowPixToInt(ImgRow):
Row = []
for pixel in ImgRow:
Int = PixToInt(pixel) #Converts Pixels into Integers
Row.append(Int)
PhotoNum.append(list(Row))
'''
Name : RowIntToPix(NumRow)
Utility : Converting a row of integers into a row of Pixels by decomposition
Parameter : NumRow : A row of integers for decomposition
Return value : None
'''
def RowIntToPix(NumRow):
Row = []
for num in NumRow: #Converts Numbers into Pixels
Pix = IntToPix(num)
Row.append(list(Pix))
NumDecomp.append(list(Row))
'''
Name : ImgArr(FileName)
Utility : Converting an image into a list
Parameter : FileName : Name of file of the image
Return value : None
'''
def ImgArr(FileName):
PhotoFrame = cv2.imread(FileName,cv2.IMREAD_COLOR)
for PixRow in PhotoFrame:
RowPixToInt(PixRow)
'''
Name : ArrImg(ArrName)
Utility : Converting an array into an image
Parameter : ArrName : Name of the list/numpy array storing the photo frame
Return value : None
'''
def ArrImg(ArrName):
for NumRow in ArrName:
RowIntToPix(NumRow)
cv2.imwrite("DEC"+FileName,numpy.asarray(NumDecomp))
FileName = input("Name of image file/path (w/ file type. e.g. PNG/JPEG)?\t")
ImgArr(FileName)
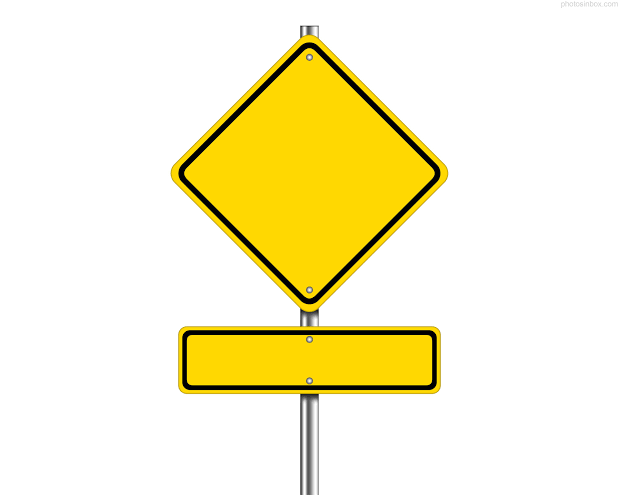
ArrImg(PhotoNum)Output #2
Here there is one input & one output & they are exactly the same.


Program #3: Colour to greyscale image conversion
Okay, this one is one of the most common digital image processing techniques. Here, I learnt about two new things :
- Greyscale images. Earlier, I used to think that greyscale images is the same as binary or black-and-white images, but it’s not true. Bitonal/Binary images only have two-pixel values, either [0,0,0] or [255,255,255], unlike greyscale images which represent the intensity of a pixel, which varies from 0 to 255.
- Human eyes perceive colour intensity differently for different colours & this has led to the development of the Luma method :
Grey = Red * 0.3 + Green * 0.59 + Blue * 0.11Here’s the program for colour to greyscale conversion :
#Description: Converting RGB image to Greyscale/Grayscale image
#Author(s)  : asxyzp
import cv2
import sys
import os.path
'''
    Name : RGBToGrey(FileName)
    Utility : RGB to Greyscale converter program
    Parameter(s) : FileName is the name of the image file for which the conversion has to be done
    Return value : None
'''
def RGBToGrey(FileName):
    if os.path.isfile(FileName):                            #Checking whether the image exists or not
        Frame = cv2.imread(FileName,cv2.IMREAD_COLOR)       #Stores image into a photo frame
        RowSize = len(Frame)
        ColSize = len(Frame[0])
        for i in range(RowSize):
            for j in range(ColSize):
                Grey = 0.3*Frame[i][j][0] + 0.59*Frame[i][j][1] + 0.11*Frame[i][j][2] #Formula for RGB to Greyscale conversion
                Frame[i][j][0] = Grey
                Frame[i][j][1] = Grey
                Frame[i][j][2] = Grey
        FileName="Grey_"+FileName
        cv2.imwrite(FileName,Frame)
    else:
        print("Image file doesn't exists.\nEnter proper file name.")
        sys.exit(1)
FileName = input("Name of image file for greyscale conversion (w/ file type)?\t")
RGBToGrey(FileName)
Output #3


Program #4: Greyscale to Binary image conversion
Obviously, after the colour image to greyscale image conversion, the next step would be converting the greyscale image to binary image conversion & I tried to do it using two algorithms & both failed (or I thought this to be the case, except that I learnt about thresholding) :
a. Algorithm 1:
if grey <= 127:
   red = 0
   green = 0
   blue = 0
else:
   red = 255
   green = 255
   blue = 255
b. Algorithm 2: Similar to algorithm 1, but replacing 127 by an average value of all pixels.
Here’s the program for algorithm 1:
#Description: Converting greyscale image to binary image
#Author(s)  : asxyzp
import os.path
import sys
import cv2


'''
    Name : GreyToBinary(FileName)
    Utility : Converts GreyScale image to Binary image
    Parameter(s) : FileName, which is the name of the image file
    Return value : None
'''
def GreyToBinary(FileName):
    if os.path.isfile(FileName):                            #Checking whether the image exists or not
        Frame = cv2.imread(FileName,cv2.IMREAD_COLOR)       #Stores image into a photo frame
        RowSize = len(Frame)
        ColSize = len(Frame[0])
        for i in range(RowSize):
            for j in range(ColSize):
                if (Frame[i][j][0]<=127):                    #Converting all pixels w/ intensity below 127 to Black
                    Frame[i][j][0] = 0
                    Frame[i][j][1] = 0
                    Frame[i][j][2] = 0
                elif (Frame[i][j][0]>127):                  #Converting all pixels w/ intensity above 127 to Black
                    Frame[i][j][0] = 255
                    Frame[i][j][1] = 255
                    Frame[i][j][2] = 255
        FileName="Bin_"+FileName
        cv2.imwrite(FileName,Frame)
    else:
        print("Image file doesn't exists.\nEnter proper file name.")
        sys.exit(1)
FileName = input("Name of image file for greyscale conversion (w/ file type)?\t")
GreyToBinary(FileName)
Output #4
The output of the above-mentioned algorithms :


After these two mistakes, I started searching for, two different ways to make this conversion happen & then I came across thresholding. I would be implementing thresholding later wards, but this is the last blog of this small series of three blog posts on playing around with images.
Summary
Here’s a small summary of all the different functions used in the program:
plt.plot(xpts,ypts,'k.'): It plots the x vs y line point-to-point line chart where ‘k. ‘ specifies the black colour points on the chart.
plt.show(): It displays the figures in the window.
plt.grid(): It displays the grid lines.
plt.xlabel('X LABEL'): It displays the x label of the chart.
plt.ylabel('Y LABEL'): It displays the y label of the chart.
plt.bar(xpts, ypts): It plots the x vs y bar chart.
Finally, this post series where I’ve covered the things that I explored while tinkering with the fundamentals of digital image processing and basically what images are, comes to and.
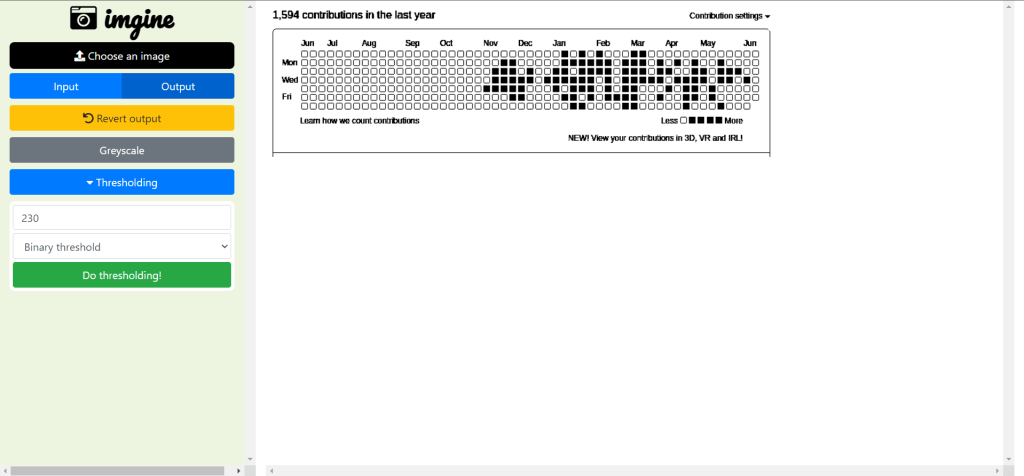
🆕 Update: I ended up building a project built using OpenCV.js called Imgine (short for “Image processing engine”) which allows performing basic image processing such as colour to binary & greyscale image conversion. It is based on the fundamentals of digital image processing: https://imgine–asxyzp.repl.co/
References
- https://www.w3schools.com/python/matplotlib_plotting.asp
- https://matplotlib.org/stable/api/_as_gen/matplotlib.pyplot.show.html
- https://matplotlib.org/stable/api/_as_gen/matplotlib.pyplot.grid.html
- https://matplotlib.org/stable/api/_as_gen/matplotlib.pyplot.xlabel.html
- https://matplotlib.org/stable/api/_as_gen/matplotlib.pyplot.ylabel.html
- https://matplotlib.org/stable/api/_as_gen/matplotlib.pyplot.bar.html
