Introduction
A take-home assignment (in software engineering) is a form of an interview to demonstrate a candidate’s programming skills by building a small project, which would mimic how one would approach solving a real-life problem faced by an organization, such as the development of a dashboard to display relevant metrics in a map for a frontend engineering role or designing and developing a basic ETL system for content aggregation for a backend engineering role. This is different from a coding assignment such as building a tic-tac-toe app in React or writing an iterator class for getting the next number of a Fibonacci series. The coding assignment could take a few hours to complete, whereas you might be given a week or two to complete the take-home assignment.
In this post, I will be discussing the take-home projects I’ve built so far.
Take-home projects
[2022] Kyupid analytics | Locale.ai
Link (Problem statement): Locale.ai Frontend/UI Engineer – Hiring Task (github.com)
Link (Output): Kyupid analytics (kyupid-analytics.netlify.app)
Link (Company): No-Code Ops Control Tower | Locale.ai
Implemented using: CRA setup, React Leaflet, MUI, React Router DOM, Context API
Problem statement: Kyupid is a dating app based in Bangalore. A sample GeoJSON file containing the area boundary of Bangalore city is provided using the API. Use the APIs which provide data of the users within Bangalore for Kyupid & create a web application which plots this data in a meaningful way on a map by matching the user location to areas in Bangalore. The application should be able to visualize at least the queries such as revenue per area, number of users per area, and male/female users in the area.
Solution: I built an app over two weekends, which had a basic dashboard on the home page which showed important details such as total users, total pro users and male-to-female user ratio in the cards & it had an area-by-area breakdown of multiple parameters stored in a table. The maps screen has three tabs, the first tab shows the % of pro users in an area, the second tab shows the % of male users in an area & the last tab shows the % of female users in an area. Finally, the about page contained basic instructions about the app. This app also comes with a dark mode toggle button.
Interestingly, I’d never built a map-based app before & building this app as an assignment was really fun. I learnt how to use the react-leaflet package & the basics of GeoJSON. Funnily, I’d spent hours trying to figure out why heck is my map getting rendered in the middle of the ocean, only to realise that I was using <Polygon /> component which uses leaflet’s lat-long order (north-easting) instead of the <GeoJSON /> component which uses long-lat order (east-northing).
Fate: I cleared this round & three other rounds & got the offer letter, but unfortunately decided to not join the company for personal reasons. Though, Locale is a great company to join.
References:
- What is GeoJSON & why should you care about it? https://youtu.be/8RPfrhzRw2s
- Leaflet+GeoJSON: Why are lat-long coordinates in the wrong order? Leaflet+GeoJSON: Why are lat-lng coordinates in the wrong order? – Geographic Information Systems Stack Exchange
- React leaflet package: https://react-leaflet.js.org/

[2022] QuesionIt! | Seekho.ai
Link (Solution): QuestionIt!
Sample output: loom.com/share/7afdc8533f224c90a78025bf20bbf4b7
Link (Company): Career Growth Accelerator | Live Workshops, Courses & Certifications | Seekho
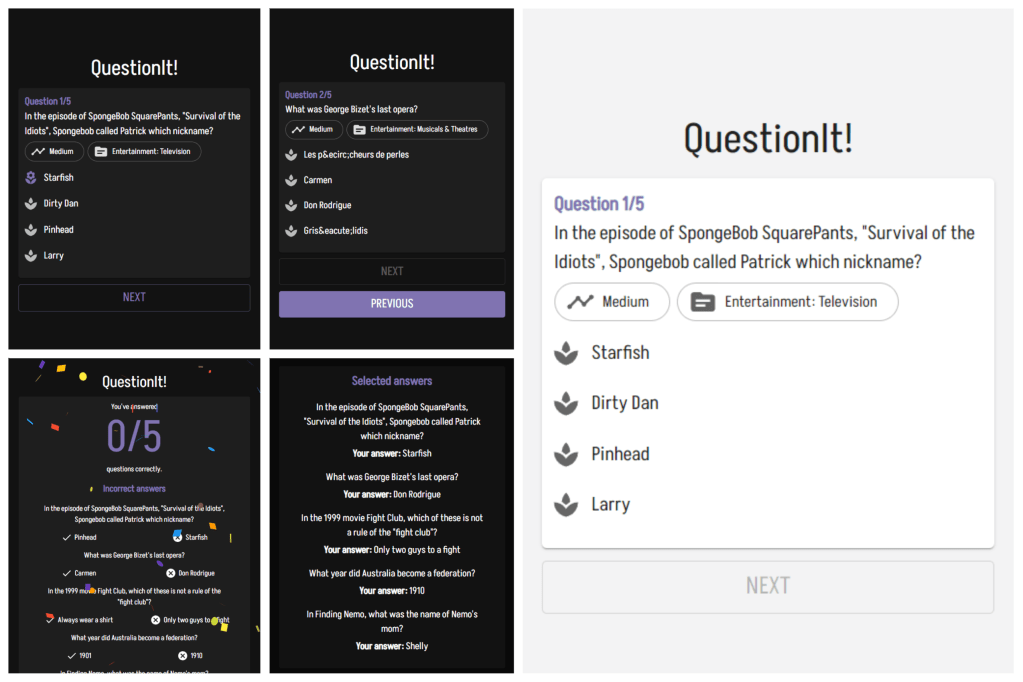
Problem statement: Build a Q&A web UI using React JS. It should also have a feature to preview the selected answers.
Implemented using: CRA setup, MUI, Open Trivia DB API, Context API
Solution: I built a really simple SPA which uses Open Trivia DB API to fetch five multiple-choice questions from multiple categories. The user can simply select the answer and press next to move to the next question. There is also an option to go back to the previous question and change the selected answer. In the bottom right corner of the app, there is a hamburger menu option clicking which opens a menu with an option called “Show selected answers”, clicking which opens a modal which shows selected answers. This app also comes with a dark mode toggle button.
Fate: [😬] Unfortunately, the position was filled till I submitted the entry.
References:
- Open Trivia DB: Open Trivia DB: Free to use, user-contributed trivia question database. (opentdb.com)
[2021] StoryTracker | Tara Capital Partners (Hedge Fund)
Link (Solution): NEWS STORY TRACKER (story-tracker.netlify.app)
Link (Company): Tara Capital Partners
Problem statement: Building an application to report news stories for traders and portfolio managers (PMs). A team of analysts tracks the news channels and markets and creates news stories for the users. Build an interface for the analysts to input the stories in a system which is then stored in the backend and then displayed to the users (Traders and PMs).
Prepare a sample single-page application which has the following functionality:
1. A story creation DIV consists of a news feed form, where in a user can create a story consisting of a title, description and username who created the story.
2. A controller invocation method, which triggers story creation and makes an HTTP request to the backend API with the story parameters.
3. A story display DIV consisting of a table which has a binding with the controller and displays the story which is created. Please assume that the response from the backend will be in JSON format.
Implemented using: CRA setup, React Router DOM, Context API
Solution: Unfortunately, I couldn’t build the backend within the required time period (3-4 hours), so I submitted only the frontend side of the project which was made up of two different screens which could be accessed by a side navigation bar, one screen was to submit the story and one screen contained the table showing different stories.
Fate: Fortunately, this project was good enough & I ended up clearing further rounds but didn’t decide to join the company in the end.
[2021] WordFreq | Terribly Tiny Tales (TTT)
Link (Company): terribly tiny tales
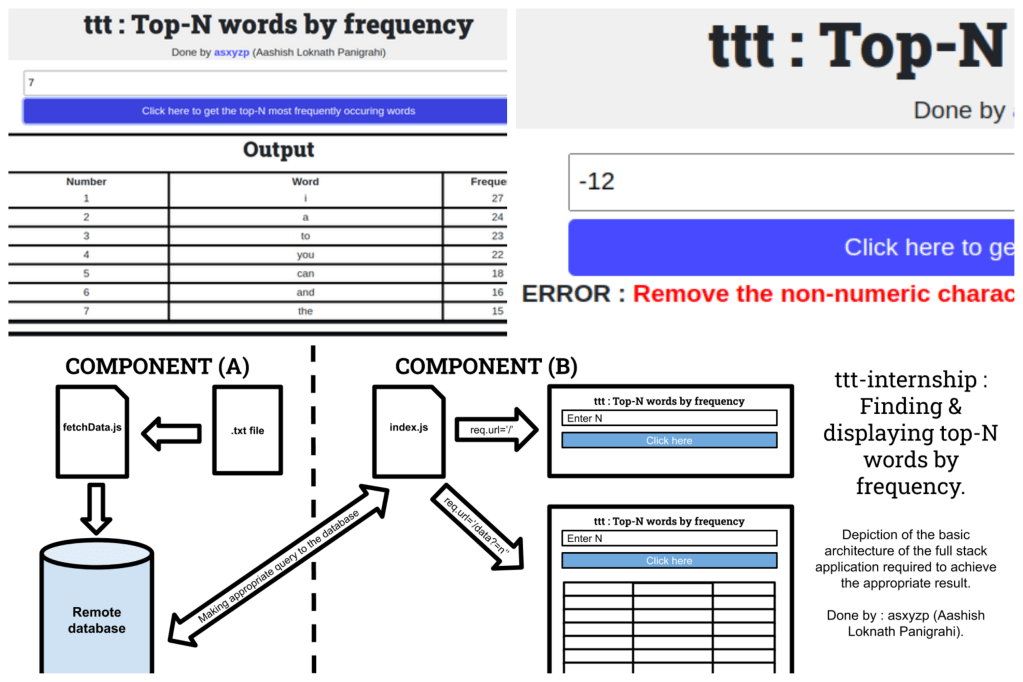
Problem statement: Building a full stack application, which has a front end which accepts a number input N with a submit button. On entering a value and pressing the submit button, a request should be sent to the backend which returns the top N most frequently occurring words in the file (http://terriblytinytales.com/test.txt) & the result is displayed in the frontend, in a tabular format.
Implemented using: Node, HTML, CSS, jQuery (LOL), MySQL
Solution: Funnily, when I was implementing this solution, I didn’t know about Express & I was just getting into to know about backend development using Node.js, so I implemented this full-stack app purely using Node.js’s HTTP module. It had a simple client-server full stack app with its entire backend app in one index.js file and its entire frontend app (including the styling and script) in one index.html file. For me, building this was “cutting edge” at that point in time.
Fate: I think the app was so bad that TTT ghosted me until I called them out on Twitter.
[2020] Trial class booking app | Notchup.co
Link (Repo): asxyzp/notchup-takehome: Building a trial class booking app as a take home project for notchup.co (github.com)
Link (Solution): NotchUp – Book a trial class (asxyzp.repl.co)
Link (Company): https://notchup.co
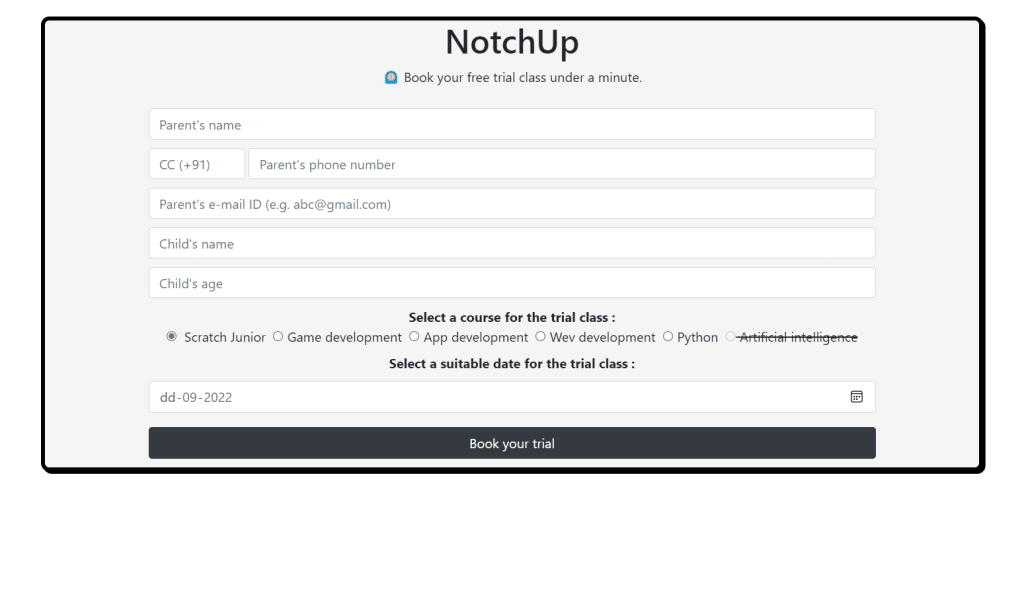
Problem statement: Building a trial class booking app with provided slot details to be fetched from their API endpoints.
Implemented using: HTML, CSS, jQuery
Solution: I was still learning about the basics of HTML & CSS & hadn’t learnt enough JS, which is why I used jQuery in these projects (including the above take-home assignment). I didn’t know about the select input, otherwise, I would’ve used it instead of using the radio button for selecting classes. Otherwise, the solution was pretty straightforward.
Fate: Unfortunately, I didn’t get a response back after making this submission, which was disappointing.
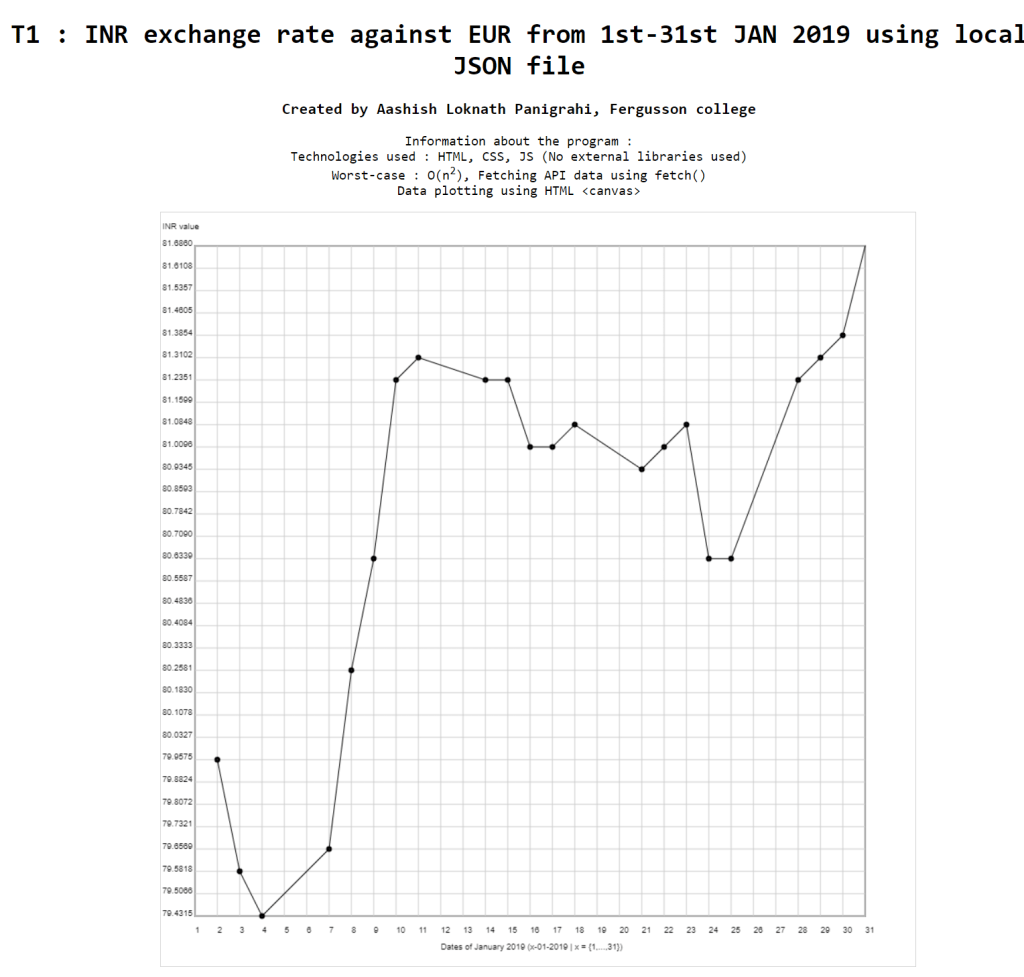
[2019] Exchange rate plotter | Winsoft Technologies Pvt Ltd
Link (Repo): asxyzp/winsoft-takehome: Exchange rate plotter built as a take-home assignment for Winsoft Technologies (github.com)
Link (Solution): Winsoft Technologies : take home project (asxyzp.repl.co)
Link (Company): Banking & Financial solutions | Winsoft Technologies (winsoftech.com)
Problem statement:
Required features
- Draw a graph which represents the performance of currencies over a period of time
- The data to plot the graph can be found in the data.json file in the GitHub repository: https://github.com/winsoft-technologies/2020-interns
- Your work is to submit anyone or all of the below-mentioned tasks.
NOTE: Applicable to [T1], [T2], and [T3]: Historic data can be found using the data.json file.- [T-1] Plot the graph of the INR exchange rate against EUR from 1 Jan 2019 to 31 Jan 2019.
- [T-2] Plot the graph of INR and GBP exchange rate against EUR from 1 Jan 2019 to 31 Jan 2019.
- [T-3] Plot the graph of INR and GBP exchange rate against EUR from 1 Jan 2019 to 31 Jan 2019 and also indicate the current rate for INR and GBP on the graph itself. (You will get the latest rates in the latest-rates.json file)
- [T-4] Replace the data.json file with the data from the REST API endpoints exposed at https://exchangeratesapi.io/. This website will provide you data regarding the exchange rate for various currencies.
Nice to have features
- Make date range dynamic so that we can select our own date range
- Make selection of currency symbol dynamic, so we can choose any currency and the graph should update accordingly. You can choose any graph style as per your choice but it should represent data in a meaningful way.
Restriction: The developer can’t use any external library or framework or tools to render the graph. Otherwise, the entry would get disqualified. There is no restriction on the language to be used.
Implemented using: HTML (Canvas), CSS, jQuery
Solution: The last sentence on the restriction is pretty important here because I couldn’t have used any external library or framework or tool for rendering the graph. Since there is no restriction on the language that I could’ve used, so I chose the vanilla web setup (HTML, CSS & JS) with the graph being rendered on the HTML canvas. Since there is no way to directly load a JSON file into the browser without using an HTTP server to serve the JSON file, so doing tasks T1-3 was out of scope as I didn’t want to take the risk of using a simple HTTP server which could’ve been counted as an external tool. And I ended up solving task T4 using the above-mentioned task. Fortunately, I ended up clearing the round & in the end, I interned at Winsoft for 6 months.
Summary
I can be self-critical at times, but I can still feel that I’ve become a better developer over the period of two years & this is because of building multiple prototypes over & over again. There’s no other way to learn this stuff. Here are my views on take-home assignments:
For companies
I hold the view that the take-home assignments are the best way to filter out most of the candidates in the early stages of hiring because it requires some dedication to executing it & have the “skin in the game”. Also, the employer can test whether the developer has the required skills to build something coherent or not.
Also, don’t ghost the devs who’ve submitted their assignments. If the work is not satisfactory enough, then even dropping a mail with two lines rejecting the submission should be good, but it’s really disappointing when there’s no response at all.
For developers
I believe that you should try to complete the assignment even when you don’t think that you’ve all the necessary skills to complete them. If you’re taking a longer time, then you should respond back to the company with the same.
